What Is Cisco Nexus Dashboard And Its Installation Procedure As A Cluster?
Cisco Nexus Dashboard is a single point of automation from which multiple data center sites can be managed. It is a common platform for hosting Cisco data center services such as Nexus Dashboard Insight and Nexus Dashboard Orchestrator. These services provide real-time analytics, visibility, and assurance for network policies and operations.
Image source – Cisco License.
The benefits of Nexus Dashboard are listed below
- Monitors and analyses the network in real-time
- Discovering hardware failures in the network.
- Discovering environmental problems like the high temperature of the devices.
- Detect when threshold values of network devices are reached or exceeded
- Easy to check for problems in the time range when a problem has happened.
Deployment Of Cisco Nexus Dashboard As A 3 Node Cluster
The Nexus Dashboard platform is a hardware-based cluster form factor consisting of a minimum of 3 nodes expandable to 7 nodes. In 3 node cluster, we can add additional nodes as worker nodes for horizontal scaling and standby nodes for easy cluster recovery in case of master node failure. For 3-node clusters, at least 2 master nodes are required for the cluster to remain operational.
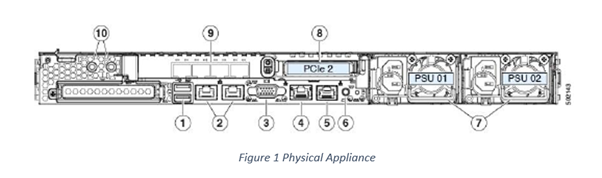
The following steps show how to deploy the physical appliance of Nexus Dashboard.
Step 1: Connect the keyboard and mouse to the USB port (labelled 1) of the server and the VGA monitor to the VGA video port (labelled 3) via the DB-15 connector.
Step 2: Power on the Server
Step 3: At the BIOS screen press F8 to enter the CIMC configuration utility
Step 4: In the CIMC configuration utility change the following fields.
- NIC mode—Select Dedicated
- IP (Basic)—Select IPV4.
- DHCP—Disable DHCP if enabled.
- CIMC IP—Enter the IP address of the CIMC.
- Prefix/Subnet—Enter the subnet of the CIMC.
- Gateway—Enter the Gateway address.
- Preferred DNS Server—Enter the preferred DNS server address.
- NIC Redundancy—Set None
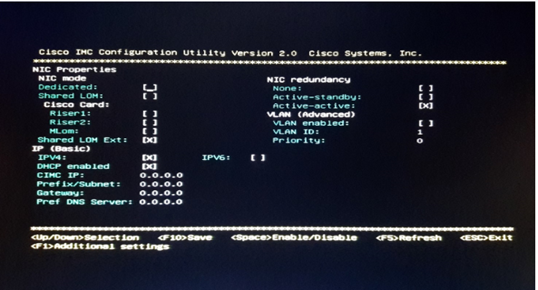
Step 5: Press F10 to save the settings.
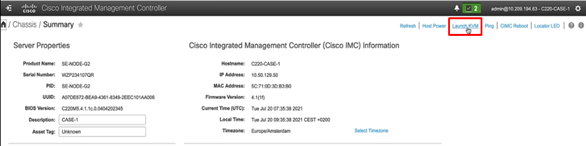
Step 6: After the setting is saved, open a browser, enter the following URL: https://CIMC_ip_address and enter the default username (admin) and default password (password).
Step 7: Launch the KVM console on the first node. Need not be configured on all the nodes.
Step 8: In the next dashboard enter the admin password and Out of Band Management Network.
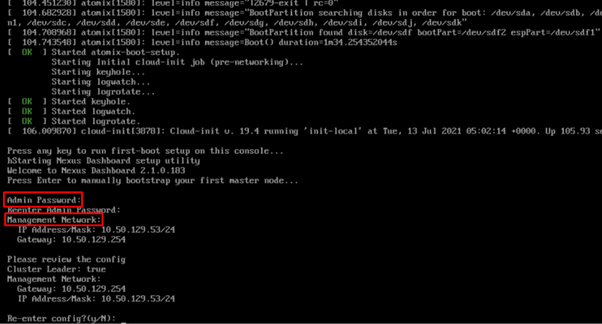
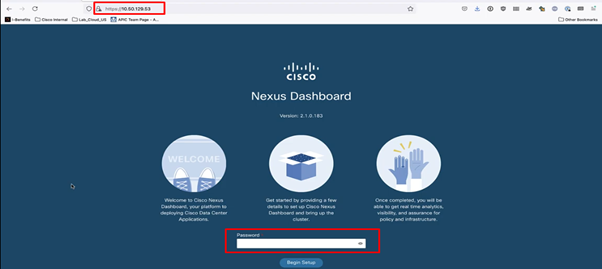
Step 9: After saving the configuration, open the browser and enter the URL https://Mgmt_IP_node
Login with the password created.
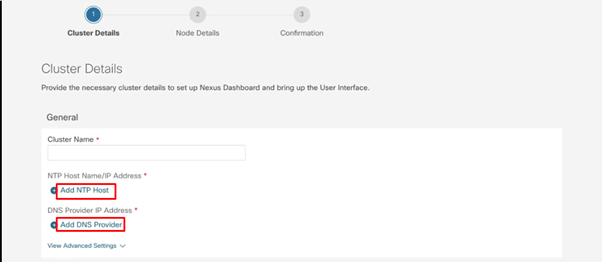
Step 10: Once you login into the Nexus Dashboard enter the cluster name, NTP address and DNS address and then click next.
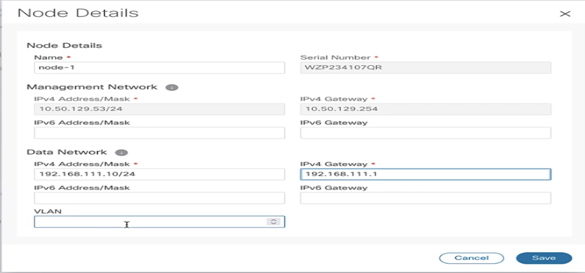
Step 11: On the next page we will get an option to configure the data network of the node. We can see the management network of the first node is already configured.
Note: The data network will reside on the data interface of the server and will be used for the following reason.
- Used to reach the fabric.
- Used between 3 nodes to form the cluster.
- Will be used by the application for telemetry data.
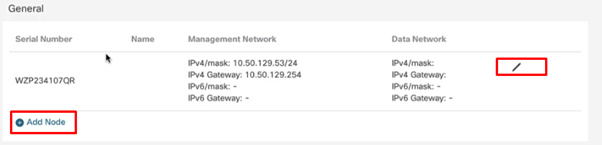
Fill in the node name and data network detail.
Step 12: Click add Node to configure the second node. Enter the Node Name, and CIMC details.
Click Verify. Now, this node will login into the CIMC of the node mentioned and fetch the serial number.
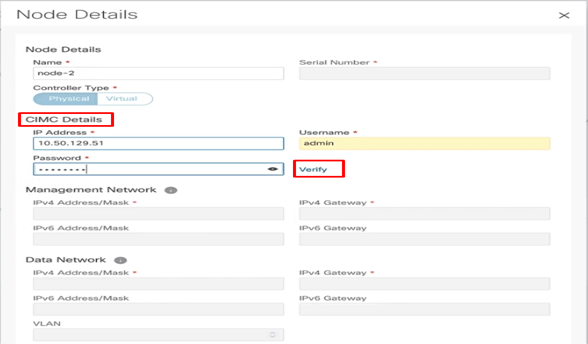
Once it gets the serial number, enter the management network and Data network details.
Step 13: Repeat the same procedure for the third node as well. Click Next to confirm the configuration and it takes some time to bring up the cluster.
Step 14: Log in to any node via SSH and verify the health cluster by acs health command. In SSH the username will be rescue-user and the password will be the same as set in Step 8. For logging via Web username will be admin and the password will be the same set in Step 8.
For more information on the deployment of Nexus Dashboard go through Cisco Nexus Dashboard Deployment Guide. In the next blog, we will see the functionalities of Nexus Dashboard Orchestrator and Nexus Dashboard Insights.
Zindagi Technologies is an IT consulting company having engineers with decades of experience in planning, designing, and implementing Data Centers along with Managed IT Services, cybersecurity, and cloud services. If you want to secure your network, we are just a call away. Please ping us at +91-9773973971 or drop a mail.
Author
Jainul Khan
Associate Consultant