CISCO DNA CENTER WORKFLOW ASSURANCE
This blog is a continuation of our CISCO DNA CENTER WORKFLOW Series. In Part 1, we discussed the Design of Cisco DNA Center Workflow, in the second part, we discussed the Policies of Cisco DNA Workflow, whereas, in the third part, we discussed the Provision aspect of Cisco DNA workflow. In this part 4, we will cover 4th pillar of the Cisco DNA Center workflow that is “ASSURANCE”.
ASSURANCE
Let us begin with a real scenario use case so you can relate with the assurance feature, that why should we use assurance?
Let’s assume your company CEO has a board meeting in the conference room, and you want to make sure that room is clear for wireless concerned, you don’t want any issues or complaints.
So, you can put the sensors there and if you wish to run the test now you can do also you can schedule the test in some days in advance to make sure all the issues are resolved by looking at these test results. The sensor is the feature that supports by assurance It is going to act like a real client which will test and provide perspective to ensure wireless services readiness some tests are given below which will be performed by the sensor.
Onboarding test = 802.11 association, authentication, IP address, DHCP, Eap-TLS, web auth
Network services = DNS, RADIUS, FHRP/Default gateway, Ipv6 host connection
App connectivity = Email (pop3, IMAP, outlook web access, FTP, http.
App performance = packet loss, jitter, latency, speed test, etc.
In the end, it will make you 100% sure that you won’t run any wireless issues.
Introduction
We use the Cisco DNA Center assurance tab to identify critical information, problems, monitoring as well as troubleshooting of the network.
Companies are tackling with plenty of network data, tracking that data, dealing with speed, the accuracy of network data is crucial for organizations. Assurance is designed by cisco to handle the network data, addresses many common use cases, including:
– Context telemetry sources
– Telemetry configuration
– Gone through the issue tab
– Client wired and wireless health status
– device 360
– client 360
– Application 360
– Network health dashboard
– Report
– Report Templates
To provide assurance DNAC collects data from network devices, So what type of data collection mechanism is used by DNA-Center assurance.
# Contextual telemetry sources
Data type= users, users’ group, IP address management,
Data source = AD, CISCO ISE, InfoBOX, DHCP, DNS,
Mechanism = Pull (API), PxGRAID
# Network telemetry sources
Data sources = flow application, SNMP, wireless signaling, Roaming Data, Syslog, Netflow, etc.
Source = Network devices, WLC/AP
Mechanism= Push and pull
What Is The Use Of Telemetry Here?
Telemetry tool is used to push configuration like Syslog, SNMP, and NetFlow required by assurance to network devices.
Telemetry Configuration
-> Streaming telemetry is configured on the WLC once it is discovered by DNAC, therefore you do not need to configure the telemetry profile on WLC.
-> By default, in the maximum telemetry profile Syslog, SNMP, SNMP trap, and NetFlow is configured for network devices.
-> DNAC can configure NetFlow only on IOS 16.X and newer.
-> On any interface, you need to configure NetFlow, the description must include the keyword ‘LAN’.
-> While discovering and provisioning the devices at the time we do all configurations.
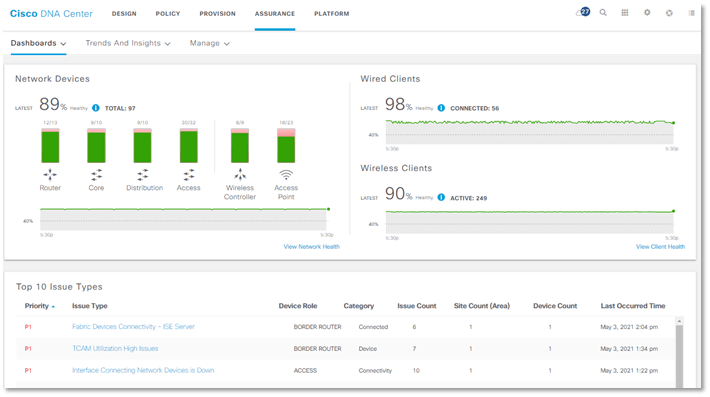
Network Devices
We can see network health by device route / type: we can select wireless/ core / access / distribution / router / access point
On DNAC Home >> Assurance >> Health >> Overall health summary and click on View network health and it will open the detailed view of all network devices likewise given below screenshot.
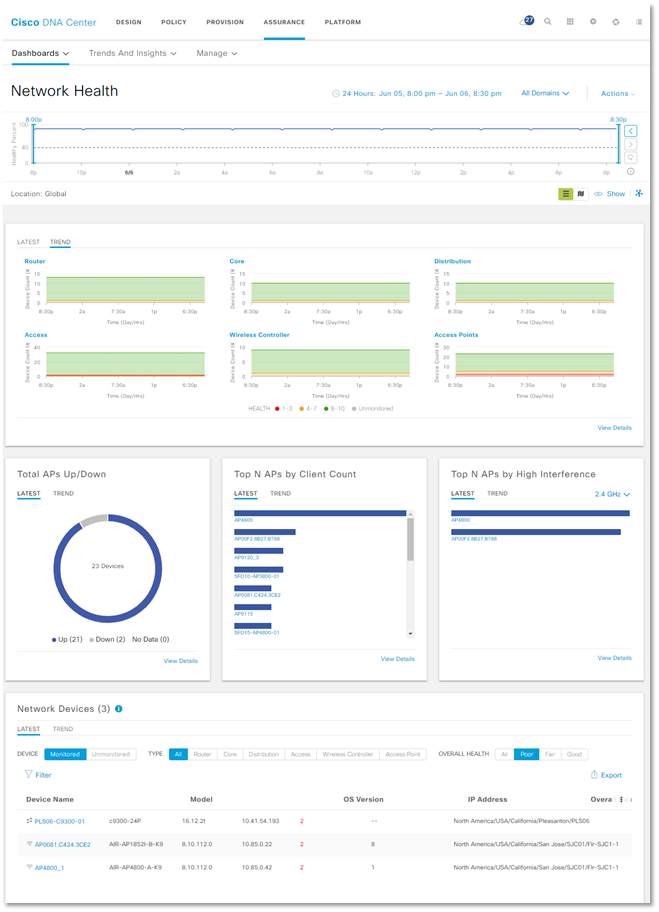
– You will get a timeline here for what period you want to see the detailed view and it can show up to 14 days.
– You can see domain/site-wise as well, ie. In building A how many devices are there we can see.
– From the actions option, you can customize the page. In the above, we have selected Global.
– Below there are two options LATEST & TREND from the Latest you can see network devices’ health soccer and from trend, you can see the timely view of health and devices as per their roles.
– You can also see the total APs up/ down score
– Total numbers of AP by client count AP model-wise. When you more you mouse pointer over any AP name it will show you the number of connected clients to that particular AP.
– You can also view the number of connected devices with 2.4 and 5 GHz separately, as well as can be found the APs which are in high interference.
– And you can see category-wise devices like Router | Core | Distribution | Access | WLC | AP and can also apply filters to as well as you can select the device type and see their health Poor | Fair | Good with their location.
If you want more details about a particular device, let’s say you found one access switch in POOR health so you want to see all about that switch in detail so you just need to click on the device MAC address, and this will open a new Device 360 for that specific device.
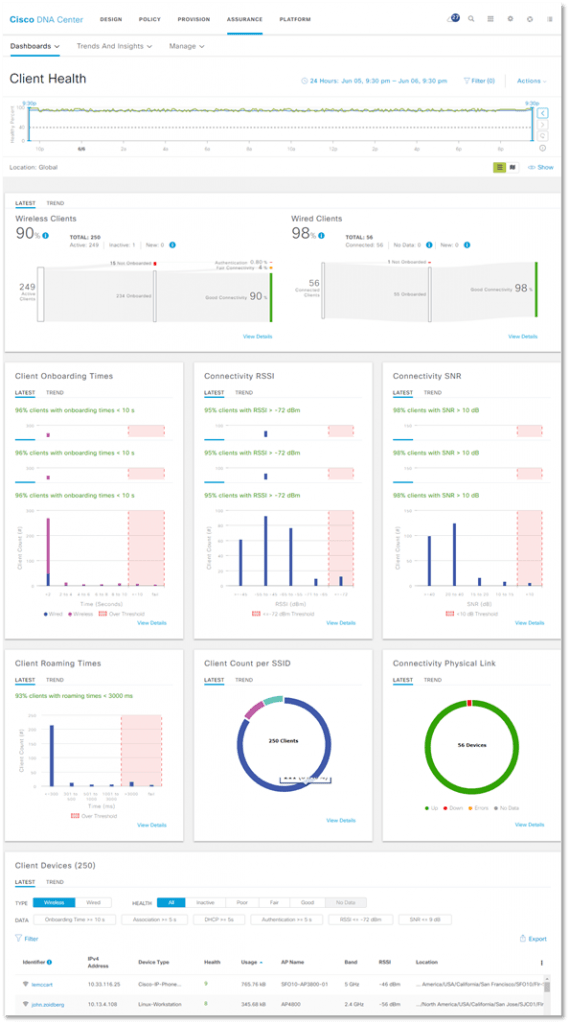
Client
Likewise, in Network health we can also see Client health and top issues for reference screenshot is given below for the Client health which tells a lot about clients like.
– Filter view for Global and site bases.
– Show total wired and wireless clients.
– Client onboarding times (< 10 s)
– Connectivity RSSI and SNR
– Client remaining times
– Client count per SSID.
– Connectivity physical link.
– Total number of connected clients and can use filters and can be found some useful data i.e.
Onboarding Time >= 10 s
Association >= 5 s
DHCP >= 5s
Authentication >= 5 s
RSSI <= -72 dBm
SNR <= 9 dB
– Can see client count per band
– Can see client data rate, as well as client protocol like 802.11n/ac/ax
So basically, we have seen the overall health score of our devices from the default dashboard, and if you want to go deep inside for a detailed view of our network devices, wired clients, wireless clients, and application that are running inside our network and their health score, and if found something poor health than we can resolve that via DNAC.
For doing so we made this blog in two parts and in this blog we have covered the overall features, in the next blog which will be the 2nd part of ASSURANCE we’ll cover troubleshooting for wireless, wired, application-related stepwise, and Device /Client / Application 360.
Are You Planning To Deploy A Cisco Software Defined Network?
If you are planning for a Green-field Deployment, Tech Refresh, Migration from your traditional campus/enterprise network to a Software Defined Network Solution You can always reach out to us, the team at Zindagi Technologies consists of experts in the field of SD-Access, Data Centre technologies, Virtualization, Private Cloud, Public Cloud, Data Center Networks (LAN and SAN), Collaboration, Wireless, Surveillance, Openstack, ACI, storage and security technologies with over a 20 years of combined industry experience in planning, designing, implementing and optimizing complex Data Centre, campus and cloud deployments. We will be glad to help you, give us a call at +919773973971.
Author
Ravi Kumar Singh
Consulting Engineer-Enterprise Networking