How To Install Prometheus and Grafana on Ubuntu LTS?

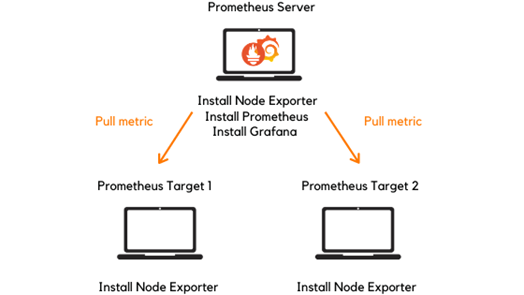
In this article, we are going to cover Installation of Prometheus and Grafana on Ubuntu LTS with Node Exporter Monitoring Linux server.
What is Prometheus?
- Prometheus is an open-source Linux Server Monitoring tool mainly used for metrics monitoring, event monitoring, alert management, etc.
- Prometheus has changed the way of monitoring systems and that is why it has become the Top-Level project of the Cloud Native Computing Foundation (CNCF).
- Prometheus uses a powerful query language i.e. “PromQL”.
- In Prometheus, tabs are on and handle hundreds of services and microservices.
- Prometheus use multiple modes used for graphing and dashboarding support.
Prometheus Architecture
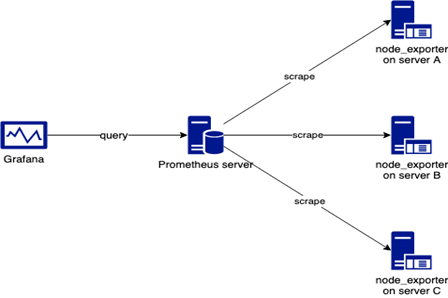
- As above we can see the architecture of the Prometheus monitoring tool.
- We made a basic design to understand it easier for you people.
Now let’s understand the Prometheus components one by one.
1. Prometheus Server
- The Prometheus server is the first component of Prometheus architecture.
- Prometheus server is a core of Prometheus architecture which is divided into several parts like Storage, PromQL, HTTP server, etc.
- In Prometheus, server data is scraped from the target nodes and then stored int the database.
- 1.a. Storage
- Storage in Prometheus server has local on-disk storage.
- Prometheus has many interfaces that allow integration with remote storage systems.
- 1. b. Prom QL
- Prometheus uses its own query language i.e. PromQL which is a very powerful querying language.
- PromQL allows the user to select and aggregate the data.
2. Service Discovery
- The next and very important component of Prometheus Server is the Service Discovery.
- With the help of Service discovery, the services identified are needed to scrape.
- To Pull metrics, identification of services and finding the targets are compulsorily needed.
- Through Service discovery, we monitor the entities and can also locate their targets.
3. Scrape Target
- Once the services are identified and the targets are ready then we can pull metrics from them and can scrape the target.
- We can export the data of the endpoint using node exporters.
- Once the metrics or other data is pulled, Prometheus stores it in local storage.
4. Alert Manager
- Alert Manager handles the alerts which may occur during the session.
- Alert manager handles all the alerts which are sent by the Prometheus server.
- The alert manager is one of the very useful components of Prometheus tool.
- If in case any big error or issue occurs, the alert manager manages those alerts and contact human via E-mail, Text Messages, On-call, or any other chat application service.
5. User Interface
- The user interface is also an important component as it builds a bridge between the user and the system.
- In Prometheus, the user interface is not that user-friendly and can be used for graph queries.
- For good exclusive dashboards, Prometheus works together with Grafana (visualization tool).
- Using Grafana over Prometheus to visualize properly we can use custom dashboards.
- Grafana dashboards display via pie charts, line charts, tables, and good data graphs of CPU usage, RAM utilization, network load, etc with indicators.
- Grafana supports and runs with Prometheus by querying language i.e. PromQL.
- To fetch data from Prometheus and to display the results on Grafana dashboards PromQL is used.
What is Grafana?
- Grafana is a free and open-source visualization tool mostly used with Prometheus to monitor metrics.
- Grafana provides various dashboards, charts, graphs, and alerts for the particular data source.
- Grafana allows us to query, visualize, explore metrics and set alerts for the data source which can be a system, server, nodes, cluster, etc.
- We can also create our own dynamic dashboard for visualization and monitoring.
- We can save the dashboard and can even share it with our team members which is one of the main advantages of Grafana.
What is Node Exporter?
- Node exporter is one of the Prometheus exporters which is used to expose servers or system OS metrics.
- With the help of a Node exporter, we can expose various resources of the system like RAM, CPU utilization, Memory Utilization, and disk space.
- Node exporter runs as a system service which gathers the metrics of your system and those gathered metrics are displayed with the help of the Grafana visualization tool.
Prerequisites
- Ubuntu with 20.04 Version
- A root user account with sudo privilege.
- Prometheus system user and group.
- Sufficient storage on your system and good internet connectivity.
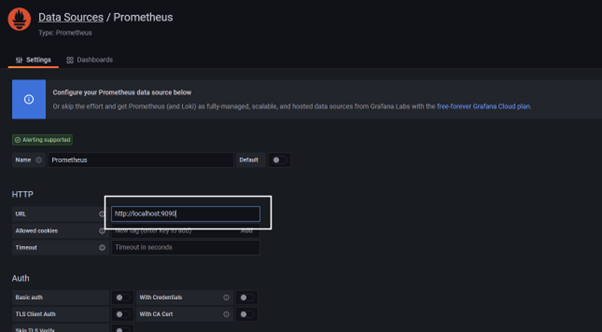
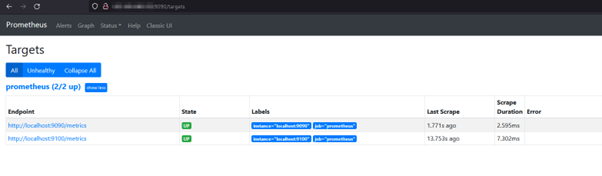
- Ports Required- 9090 (Prometheus), 3000 (Grafana), 9100 (Node Exporter)
We will update the system repository index by using the following command.
After adding the program save the file with Ctrl+O and exit with Ctrl+X.
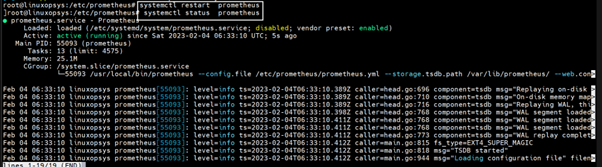
To use the newly created service we will have to reload the daemon services, Use the
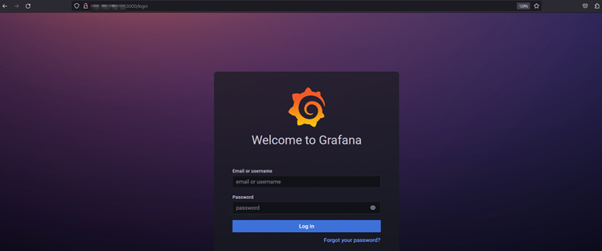
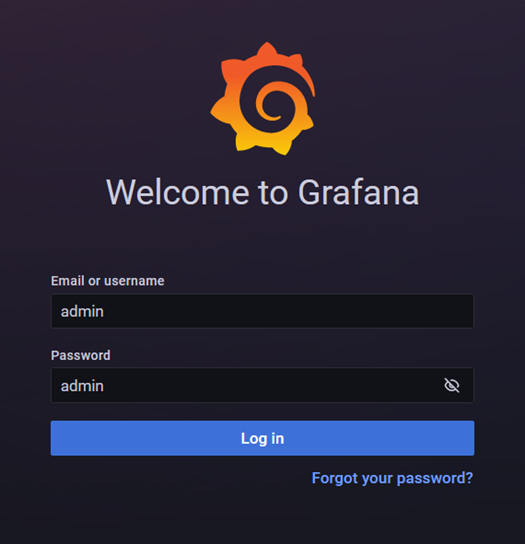
It is always a good practice to change your login credentials.
Install Node Exporter on Ubuntu 20.04 LTS
Node Exporter collects the metrics of your system such as Memory usage, CPU usage, RAM, disk space, etc.
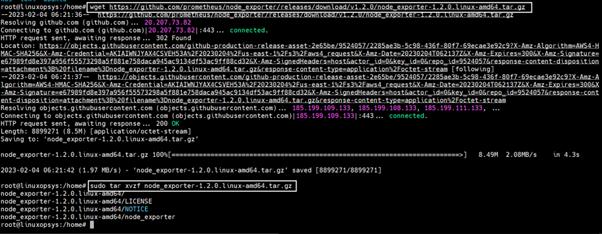
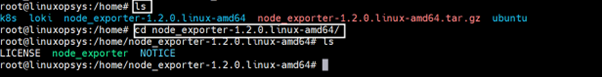
To install Node Exporter first navigate to Prometheus official download page, Scroll down and you will get the node exporter section and then select Linux OS for amd64.
tar –xvf node_exporter*
Creating Node Exporter System service

Creating Node Exporter systemd service
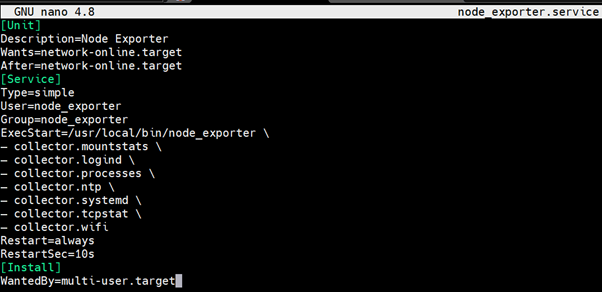
Now let’s create a node exporter service in /lib/systemd/system directory named node_exporter.service using the below commands
cd /lib/systemd/system sudo nano node_exporter.service
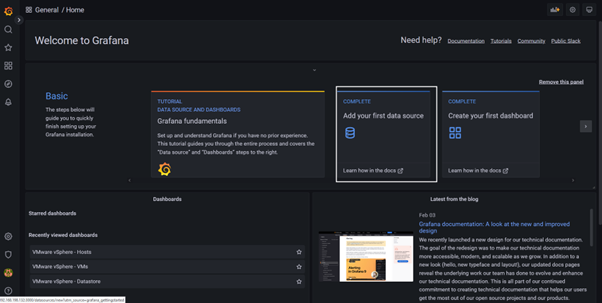
Creating Grafana Dashboard to Monitor Linux Server
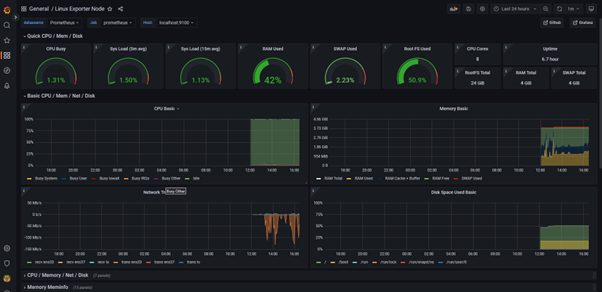
Now let’s build a dashboard in Grafana so then it will able to reflect the metrics of the Linux system.
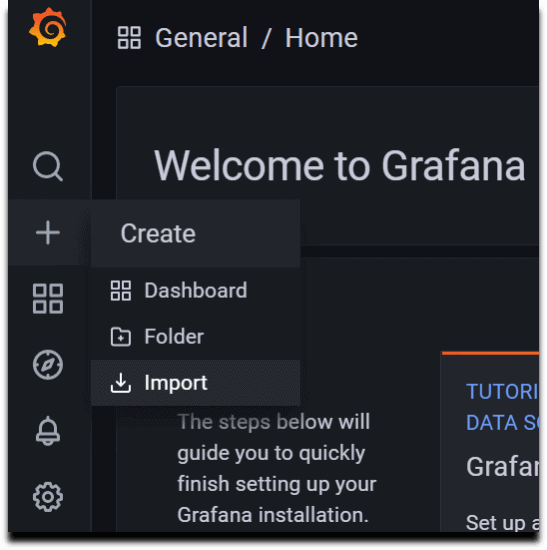
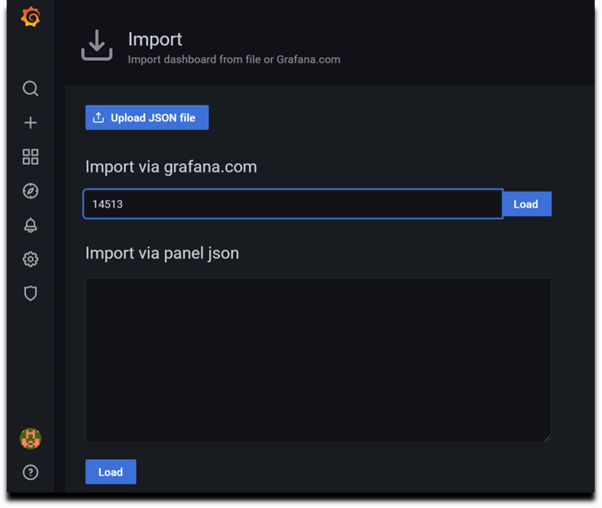
So we will use 14513 to import Grafana.com, Let’s come to the Grafana Home page and you can see a “+” icon. Click on that and select “Import”.
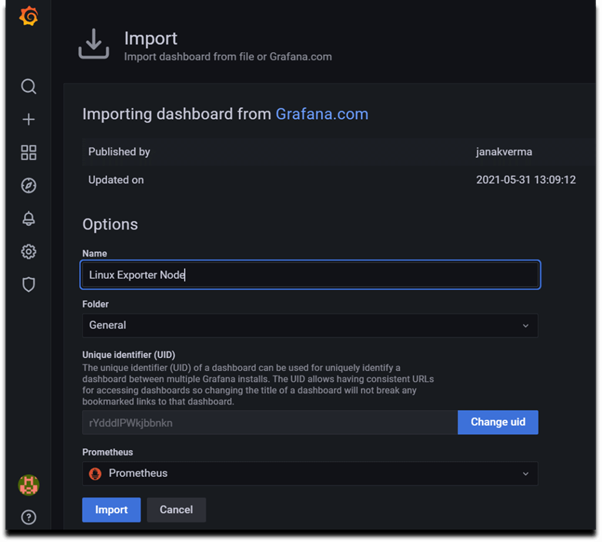
Now provide the name and select the Prometheus Datasource and click on Import.
I hope this blog will be helpful for you to understand the Core Concept of Grafana & Prometheus and Its different methodologies which we can use in a production environment.
The goal of this blog is to provide you, the reader, with a fundamental grasp of Ansible. A complete SMB or enterprise-level deployment, on the other hand, is significantly more complicated and needs solution architecture from the ground up, taking into consideration future scalability as well as real deployment and daily operations, as we all know. Zindagi Technologies offers services like a security operation center, DevOps tools, and many more to aid you in implementing cloud-based applications successfully. If you have any questions, comments, or suggestions, please contact us at +919773973971.
Author
Sourabh Dey
Associate Consultant – Server & Virtualization