Breaking Down “TOP” Command In CentOS
In the last blog, we explained managing network in CentOS with NetworkManager Services. In this blog, we will explain the benefits of the Top command inside CentOS or any Linux machine. The Top command is used to show the Linux processes. The Top command provides a dynamic real-time view of the running system. Usually, this command shows the summary information of the system and the list of processes or threads which are currently managed by the Linux Kernel.
As soon as you will run this command it will open an interactive command mode where the Top half partition will contain the statistics of processes and resource usages. And Lower half contains a list of the currently running processes.
Here we explain the output,
First Line – “Uptime and load average”
Each of the following three areas is individually controlled through one or more interactive commands.
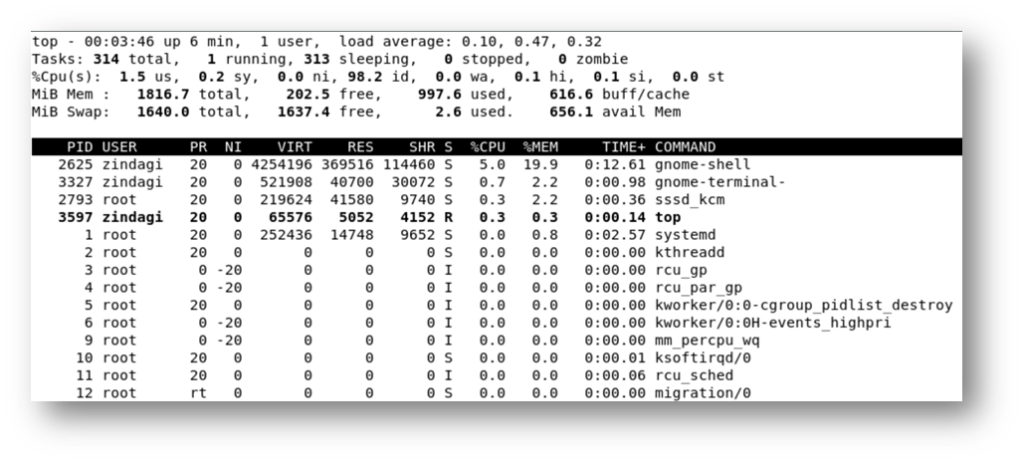
top – 00:03:46 up 6 min, 1 user, load average: 0.10, 0.47, 0.32 –
this portion consists of a single line containing: program or command name, depending on display mode current time and length of time (00:03:46 up 6 min) since last boot total number of users (1 user) and system load average over the last 1min (0.10), 5min (0.47) and 15min (0.32).
Second Line – “Task state”
Line 2nd shows total task or treads, depending on the state of the Thread-mode toggle. That total is further classified as:
Running; sleeping; stoped; zombie;
Third Line – “CPU state”
Line 3rd shows CPU state percentage based on the interval since the last refresh.
As a default, the percentage for their individual categories is displayed. Where two labels are shown below, those for the more recent kernel version are shown first.
- us, user: time running un-niced user processes.
- sy, system: time running kernel processes.
- ni, nice: time running niced user processes.
- Id, idle: time spent in the kernel idle handler.
- wa, IO-wait: time waiting for I/O completion.
- hi: time spent servicing hardware interrupts.
- si: time spent servicing software interrupts.
- st: Time stolen from this vm by the hypervisor.
In the alternate CPU state display mode, beyond the first task/thread line, an abbreviated summary is shown consisting of these elements.
a b c d
%CPU(s) : 75.0/25.0 100[ …..
Where: a) is the `user’ (us + ni) percentage; b) is the `system’ (sy + hi +si) percentage; c) is the total; and d) is one of two visual graph of those representation.
Fourth Line – “Memory state”
Inside the 4th line, it represents the total memory, free memory, used memory, and buffer and cache memory. All memory calculations in MB.
MiB Mem: 1016.7 total; 202.5 free; 997.6 used; 616.6 buffer/cache
We have total memory is 1GB, out of this free memory is 202.5 MB, and we used out of 1GB, 997.6MB and for cache or buffer 616.6MB.
Fifth Line – “Swap memory state”
Swap memory is necessary for two important reasons. First, when the system requires more memory then is physically available, the kernel swap out less used pages and give memory to the current application (process) that need the memory immediately. Second, a significant number of pages used by an application during its startup phase may only be used for the initial phase and never again.
MiB Swap: 1640.0 total; 1634.4 free; 2.6 used; 656.1 avail mem;
We have a total of swap memory is 1640MB, out of this we have free swap memory is 1634.4, and we used 2.6MB, and available swap memory is 656MB.
Here we explain the meaning of all short-form used names –
- PID – “Process I’D” Showes all tasks with the unique process Id.
- USER – Owner of the task who opens task.
- PR – Stand for priority on the task.
- NI – Represents a Nice value of the task. Here negative (-) nice value implies higher priority and (+) nice value implies lower priority.
- VIRT – Total virtual memory used by the task.
- SHR – Represent the shared memory size (kb) used by a task.
- %CPU – Represent the CPU usages.
- %MEM – Showes the memory usage of the task.
- TIME – CPU time, the same as the time.
- COMMAND – Represent running the command.
Each of the following three areas is individually controlled through one or more interactive commands.
Zindagi Technologies, the leading IT consulting company is the provider of services like Cloud solutions, Security, Planning, Designing, and Implementation of various services like Data Center, Managed IT Sevices, IT Consulting, Managed Cyber Solutions, and many more. Get in touch with us either through mail or through call +919773973971 and we will give your organization a perfect digital makeover.
Author
Deepak Kumar
Linux and Server Administrator